Metrics | tracking milestones made by PSI:Biology
Last updated: June 28, 2017
The PSI:Biology Goals and Milestone Committee was charged with determining a
list of metrics that best convey the progress and impact of the PSI:Biology Network.
Click a category name to jump down to active tabulations. Collected
PSI-1 and PSI-2 statistics can be viewed on the previous
Metrics site.
To learn how each metric is calculated, click on its data source icon (e.g. ![]() )
nearest to its column heading.
)
nearest to its column heading.
1. Quantitative Metrics
These tables provide a summary of the PSI:Biology targets being studied by the High-throughput and Membrane Protein Centers, as determined from depositions to TargetTrack or the PDB.
Table 74348. Numbers of targets in the PSI:Biology pipeline and the number of structures solved. (Metrics items 1.1-1.8)
|
|
|||||||
|---|---|---|---|---|---|---|---|
| Center | Total | Cloned | Expressed | Purified | Structure Studies (X-ray/NMR/EM) |
In PDB | Structures In PDB |
| JCSG | 9809 | 9758 | 8735 | 3323 | 2299 / 181 / 0 | 484 | 516 |
| MCSG | 8051 | 5991 | 2268 | 2103 | 1114 / 3 / 0 | 340 | 579 |
| NESG | 6696 | 4979 | 4166 | 1805 | 920 / 796 / 0 | 263 | 327 |
| NYSGRC | 25122 | 17996 | 4090 | 2902 | 1887 / 13 / 0 | 228 | 359 |
| CSMP | 168 | 147 | 124 | 26 | 17 / 0 / 0 | 1 | 5 |
| GPCR | 826 | 50 | 38 | 30 | 18 / 0 / 0 | 16 | 52 |
| MPID | 55 | 49 | 24 | 30 | 10 / 1 / 0 | 0 | 0 |
| MPSBC | 141 | 107 | 93 | 26 | 23 / 0 / 1 | 1 | 3 |
| MPSbyNMR | 14 | 14 | 14 | 12 | 0 / 11 / 0 | 3 | 8 |
| NYCOMPS | 5755 | 3134 | 1017 | 473 | 3 / 0 / 0 | 2 | 37 |
| TEMIMPS | 100 | 81 | 65 | 52 | 0 / 0 / 23 | 1 | 3 |
| TMPC | 253 | 137 | 115 | 27 | 18 / 0 / 0 | 0 | 0 |
| TransportPDB | 592 | 331 | 297 | 127 | 10 / 0 / 0 | 0 | 0 |
Table 74349. Number of PSI:Biology targets classified by Target Category (Metrics items 1.9 - 1.10)

| Center | PSI Biology Partnership |
Biomedical | Structural Coverage |
Community Nominated |
Metagenomic | Membrane Protein |
|---|---|---|---|---|---|---|
| JCSG | 2151 (22%) | 6253 (64%) | 4431 (46%) | 692 (8%) | 27 (1%) | 0 |
| MCSG | 2069 (26%) | 3963 (50%) | 3411 (43%) | 1428 (18%) | 769 (10%) | 100 (2%) |
| NESG | 1395 (21%) | 4212 (63%) | 1777 (27%) | 874 (14%) | 49 (1%) | 0 |
| NYSGRC | 2176 (9%) | 11466 (46%) | 4500 (18%) | 6980 (28%) | 0 | 0 |
| CSMP | 113 (68%) | 168 (100%) | 0 | 0 | 0 | 166 (99%) |
| GPCR | 5 (1%) | 826 (100%) | 0 | 17 (3%) | 0 | 826 (100%) |
| MPID | 0 | 55 (100%) | 0 | 0 | 0 | 55 (100%) |
| MPSBC | 0 | 0 | 0 | 0 | 0 | 141 (100%) |
| MPSbyNMR | 0 | 2 (15%) | 11 (79%) | 0 | 0 | 14 (100%) |
| NYCOMPS | 0 | 0 | 0 | 256 (5%) | 0 | 5755 (100%) |
| TEMIMPS | 0 | 0 | 0 | 0 | 0 | 100 (100%) |
| TMPC | 0 | 110 (44%) | 139 (55%) | 144 (57%) | 1 (1%) | 252 (100%) |
| TransportPDB | 0 | 592 (100%) | 571 (97%) | 11 (2%) | 0 | 592 (100%) |
2. Structure Determination
This section counts the number of different structural and biological topics targeted by the PSI:Biology network as categorized in TargetTrack.
Table 74350. Types of protein targets among the PSI:Biology structures (Metrics item 2.1)
| Type of Protein Target | No. of structures | Source |
|---|---|---|
| Single-domain proteins | 1021 | |
| Multidomain proteins | 901 | |
| Oligomeric proteins | 953 | |
| Membrane proteins | 116 | |
| Eukaryotic proteins | 257 | |
| Protein-protein complexes | 43 | |
| Protein-nucleic acid complexes | 17 | |
| Protein-ligand complexes | 1403 | |
| de novo/designed proteins | 61 |
2.2 Structure Determination Methods 
Table 74351. Classifies PSI:Biology Structure by their structure determination method.
| Year | X-ray | NMR | SAXS | EM | Other | Total |
|---|---|---|---|---|---|---|
| 2010 | 111 | 20 | 0 | 0 | 0 | 131 |
| 2011 | 315 | 57 | 0 | 0 | 0 | 372 |
| 2012 | 344 | 59 | 0 | 1 | 0 | 404 |
| 2013 | 395 | 43 | 0 | 0 | 1 | 439 |
| 2014 | 272 | 26 | 0 | 0 | 0 | 298 |
| 2015 | 164 | 25 | 0 | 0 | 0 | 189 |
| Total | 1601 | 230 | 0 | 1 | 1 | 1833 |
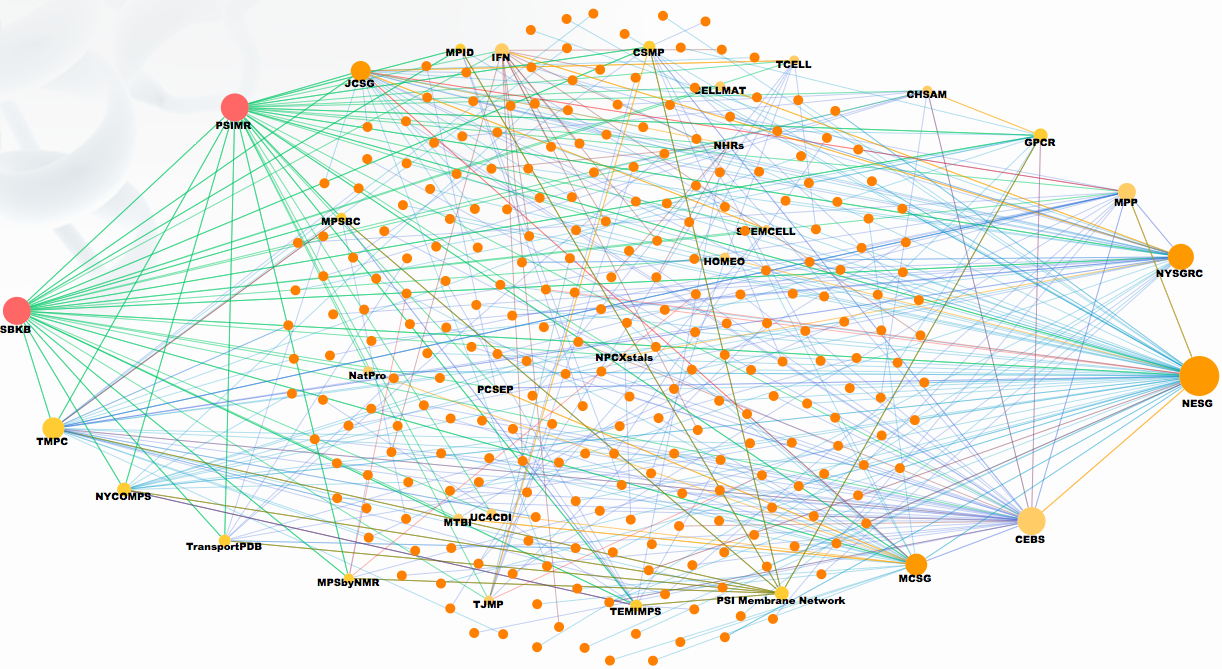
3. Network Building
One of the goals of the PSI:Biology program is to be a collaborative network for the greater biological community to rely on for structures and resources. This section counts the level of collaboration within the PSI:Biology Network and beyond it.
3.1 Collaboration
3.1.2 External to PSI
3.1.2.3 (Table 74352) Collaborations created by Community-nominated Target nominations
![]()
| Center Name | No. of Collaborations |
|---|---|
| HTP centers | |
| JCSG | 30 |
| MCSG | 24 |
| NESG | 36 |
| NYSGRC | 15 |
| Participating MP centers | |
| CSMP | 0 |
| GPCR | 14 |
| MPSBC | 0 |
| NYCOMPS | 11 |
| TMPC | 21 |
| TransportPDB | 1 |
4. Experimental Data Resources
The PSI:Biology Network makes all of its research resources available to the public. The following resource counts come from center depositions and TargetTrack.
4.1 (Table 74353) Protocols used by the PSI:Biology program.
| Center | Expression | Purification | Crystallization |
|---|---|---|---|
| HTP centers | |||
| JCSG | 3 | 2 | 3 |
| MCSG | 7 | 10 | 9 |
| NESG | 2 | 1 | 1 |
| NYSGRC | 53 | 37 | 4 |
| MP centers | |||
| CSMP | 2 | 0 | 0 |
| GPCR | 1 | 0 | 0 |
| MPID | 3 | 7 | 6 |
| MPSBC | 4 | 3 | 5 |
| MPSbyNMR | 3 | 4 | 0 |
| NYCOMPS | 6 | 6 | 3 |
| TEMIMPS | 53 | 28 | 21 |
| TMPC | 9 | 10 | 2 |
| TransportPDB | 0 | 1 | 0 |
| Biology Partners | |||
| MPP | 9 | 6 | 3 |
| NatPro | 1 | 5 | 2 |
4.2 (Table 74354) Available PSI:Biology clones.

| Center Name | Type | PSI-I+PSI-II | PSI:Biology Clones |
|---|---|---|---|
| JCSG | HTP | 24412 | 2800 |
| MCSG | HTP | 9374 | 6713 |
| NESG | HTP | 10675 | 8432 |
| NYSGRC | HTP | 10690 | 5312 |
| Total HTP centers | 55151 | 23257 | |
| CSMP | MP | 77 | 0 |
| GPCR | MP | N/A | 67 |
| MPID | MP | N/A | 180 |
| MPSBC | MP | N/A | 52 |
| MPSbyNMR | MP | N/A | 2 |
| NYCOMPS | MP | 2507 | 697 |
| TEMIMPS | MP | N/A | 15 |
| TMPC | MP | N/A | 68 |
| TransportPDB | MP | N/A | 44 |
| Total MP centers | 2584 | 1125 | |
| CEBS | BP | N/A | 0 |
| CELLMAT | BP | N/A | 0 |
| CHSAM | BP | N/A | 0 |
| IFN | BP | N/A | 0 |
| MPP | BP | N/A | 66 |
| MTBI | BP | N/A | 0 |
| NatPro | BP | N/A | 7 |
| NPCXstals | BP | N/A | 0 |
| STEMCELL | BP | N/A | 0 |
| TCELL | BP | N/A | 0 |
| PCSEP | BP | N/A | 0 |
| TJMP | BP | N/A | 84 |
| Total BP centers | N/A | 157 | |
5. Technologies
The PSI:Biology Network also develops new technologies to overcome bottlenecks in the high-throughput protein production and structural determination pipeline. During PSI:Biology, technological developments are mainly underway for the membrane protein-focused centers and the high-throughput centers. This data is calculated from the PSI Technology Portal.
5.1 - 5.5 (Table 74355) Technologies from HTP and Membrane Protein Centers.

 |
|||||||
|---|---|---|---|---|---|---|---|
| Center | PSI-I+PSI-II | Devices | Software & Servers | Protein Complexes | Eukaryotic Proteins | Membrane Proteins | PTMs |
| HTP centers | |||||||
| JCSG | 39 | 0 | 6 | 3 | 2 | 2 | |
| MCSG | 32 | 0 | 5 | 8 | 0 | 0 | |
| NESG | 38 | 2 | 9 | 7 | 1 | 1 | |
| NYSGRC | 9 | 3 | 4 | 2 | 1 | 1 | |
| Membrane centers | |||||||
| CSMP | 10 | 3 | 0 | 0 | 0 | 2 | |
| GPCR | N/A | 0 | 2 | 1 | 0 | 2 | |
| MPID | N/A | 1 | 0 | 0 | 0 | 1 | |
| MPSBC | N/A | 2 | 0 | 0 | 0 | 1 | |
| MPSbyNMR | N/A | 4 | 1 | 0 | 0 | 5 | |
| NYCOMPS | 1 | 2 | 0 | 1 | 0 | 4 | |
| TEMIMPS | N/A | 6 | 5 | 0 | 0 | 2 | |
| TMPC | N/A | 2 | 0 | 0 | 0 | 17 | |
| TransportPDB | N/A | 0 | 0 | 0 | 0 | 0 |
6. Publications
Below is a tabulation of the number, citation count, and impact of PSI:Biology publications, along with the number of times a center's PDB structure has been downloaded from all PDB sites. The download numbers exclude full PDB archive downloads. This data is collected from the PSI Publications Portal and the wwPDB site.
(Table 74356) Publications and statistics
| Center Names | No. Publications |
No. Times Article Cited |
Total Journal Impact |
No. of PDB downloads |
|---|---|---|---|---|
| JCSG | 101 | 2595 | 771.93 | 3388318 |
| MCSG | 87 | 1155 | 326.53 | 2559728 |
| NESG | 172 | 2657 | 1033.31 | 2470402 |
| NYSGRC | 46 | 1040 | 310.72 | 2052750 |
| CSMP | 23 | 825 | 232.3 | 25567 |
| GPCR | 57 | 7423 | 1033.87 | 1100263 |
| MPID | 27 | 2577 | 304.64 | 0 |
| MPSBC | 7 | 136 | 62.87 | 8934 |
| MPSbyNMR | 33 | 1449 | 303.75 | 56323 |
| NYCOMPS | 37 | 1255 | 578.05 | 58007 |
| TEMIMPS | 27 | 466 | 204.37 | 10680 |
| TMPC | 10 | 106 | 35.86 | 0 |
| TransportPDB | 7 | 221 | 37.6 | 0 |
| CEBS | 7 | 245 | 71.71 | 36093 |
| CELLMAT | 11 | 239 | 47.83 | 13095 |
| CHSAM | 28 | 1687 | 182.14 | 0 |
| IFN | 5 | 104 | 36.3 | 183456 |
| MPP | 25 | 330 | 127.25 | 74913 |
| MTBI | 7 | 4028 | 38.37 | 214998 |
| NatPro | 17 | 180 | 74.06 | 194457 |
| NPCXstals | 2 | 10 | 2.81 | 18499 |
| STEMCELL | 6 | 84 | 52.06 | 113444 |
| TCELL | 1 | 15 | 0.0 | 303296 |
| PCSEP | 14 | 142 | 49.47 | 100912 |
| TJMP | 5 | 86 | 20.56 | 0 |