Education Corner
Creating Accessible Tools for Molecular Visualization Instruction
By Kristen Procko, Diane Dean, Daniel Dries, Margaret Franzen, and Henry Jakubowski
Kristen Procko, Ph.D.

Kristen Procko is a Visiting Assistant Professor at the University of Saint Joseph, Connecticut, where she has helped transform the way students visualize chemistry and biochemistry. Whether teaching undergraduates through research, creating graduate level courses that integrate molecular visualization (MV), or through her work as BioMolViz group lead, Kristen's goals are the same: connect people to chemistry through molecular visualization.
Currently, Kristen is serving as the primary faculty for the Chemistry and Biochemistry Master’s Program at USJ, which has given her the opportunity to expand her research to include deeper pedagogical studies on the molecular visualization methods she designs for her fully digital graduate courses. With one eye always on future trends, her newest project explores the utilization of virtual reality as a platform to support MV where she has already created original 3D content that is open source and ready to bring chemistry to life for her students and the world.
The BioMolViz Group
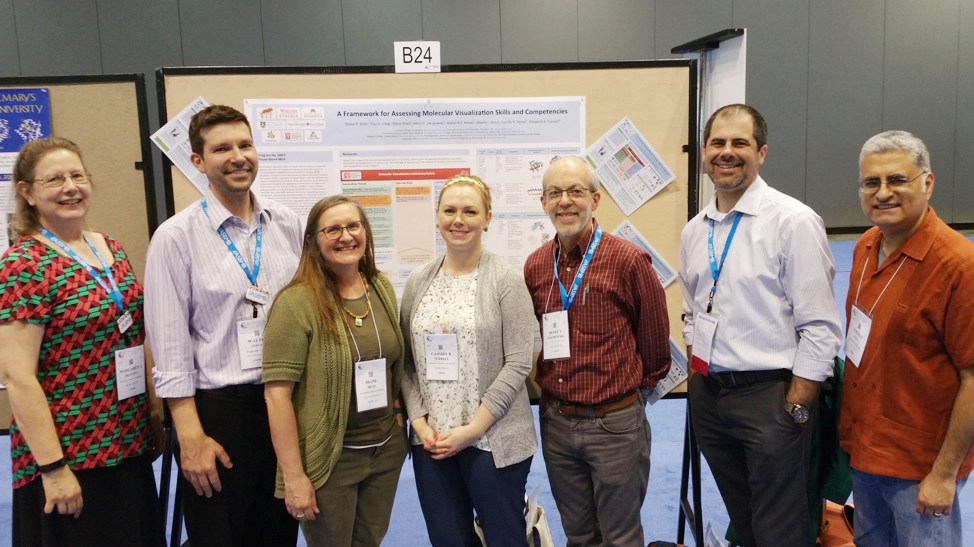
The BioMolViz group is a team of 10 U.S. biochemists, chemists, and molecular biologists teaching at institutions that range from 1,500–50,000 students. Geographically, the group spans from coast to coast and Wisconsin to Texas. Diane Dean (third left) is a chemistry professor at the University of Saint Joseph where she has taught for 19 years, utilizing many techniques for engaged learning including developing materials to teach MV in an online environment. Dan Dries (second right) is an assistant professor of chemistry and biochemistry at Juniata College and the Principal Investigator of the project described in this article. Margaret Franzen (first left) is a Program Director at the MSOE Center for BioMolecular Modeling, where she focuses on the undergraduate CREST (Connecting Researchers, Educators and STudents) Program, Science Olympiad Protein Modeling Event, MSOE Model Lending Library, professional development for educators, and studying the impact of physical models on student learning. Henry Jakubowski (third right) is a chemistry professor at the College of St. Benedict/St. John’s University where he has taught for 31 years, and is the author of an online biochemistry textbook entitled Biochemistry Online: An Approach Based on Chemical Logic, which is freely available through the CSB/SJU web site and as a core reference in the Biology LibreTexts available through UC Davis.
Biochemists love images. We have all looked at representations of single molecules or supramolecular assemblies and had the experience of an understanding of the structure being crystalized in our brains. As instructors, we hope—and research has shown, often expect—that our students are having similar “aha!” moments with the pictures of cells, proteins, and biomolecular complexes we present.1 But, do the students really see what we see? How do we determine if the students understand the cartoon images we use to represent biological phenomena? And when they don’t possess the necessary visual literacy skills, what can we do to improve our instruction?
A Team Dedicated to Improving Visual Literacy
Given their importance in illustrating complex concepts, figures are ubiquitous in biology and biochemistry textbooks. However, educators do not often assess the students’ understanding of these images, assuming they grasp the visual concepts. Work has been done to develop explicit standards and assessments on metabolic pathway figures,2 and to engage students in publishable research projects involving molecular visualization.3 But what about the student in the back of the biology or chemistry classroom—do they understand that the ball-and-stick representation shown in a figure is the same protein as the space-filling model beside it? By explicitly assessing visual literacy skills, we can determine if our efforts to teach molecular visualization (MV) are working. Improved methods to assess student knowledge and create effective teaching tools will ultimately make biology education more accessible for all students.
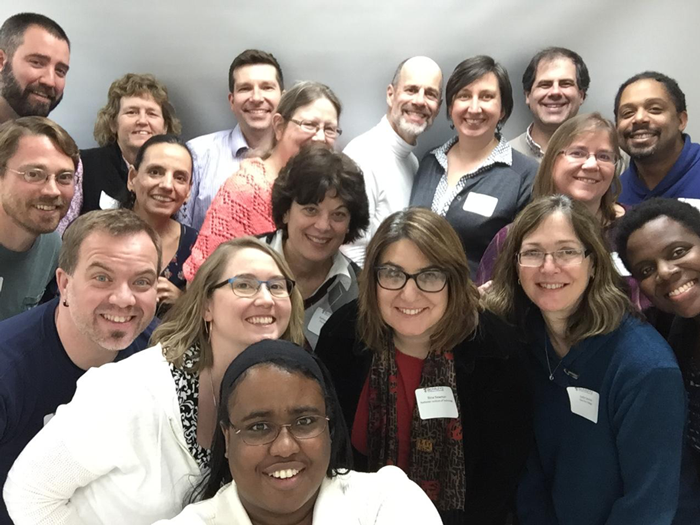
The working group from the Morgan State BioMolViz workshop
For seven years, The BioMolViz group has been working to advance MV instruction. Over the course of the project, 15 faculty from 14 institutions have participated in regular online meetings, bringing visual literacy education from the recognition of a need to a published Molecular Visualization Framework defining 12 overarching themes, 27 learning goals, and 119 learning objectives (http://cbm.msoe.edu/crest/molviz/).4 The ultimate goal is to populate the framework with assessment instruments that target specific MV learning goals and objectives. Instructors will be able to use the framework to identify the visual literacy skills they wish to test, and in a couple of clicks have a targeted, peer-reviewed MV assessment question to use in their classroom or modify to suit their instructional needs.
Workshops to Engage the Molecular Visualization Community
Participants worked in teams to write and revise assessments prior to reporting out to the larger group

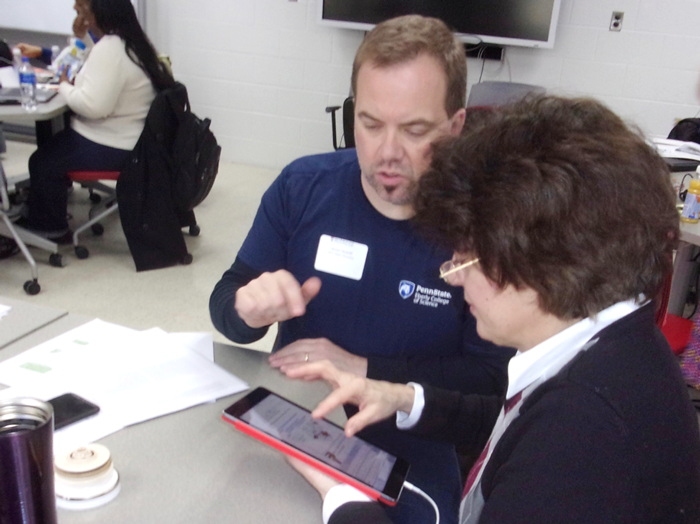
Henry Jakubowski (lower left) discusses framework-driven assessment design with workshop participants in San Diego, CA
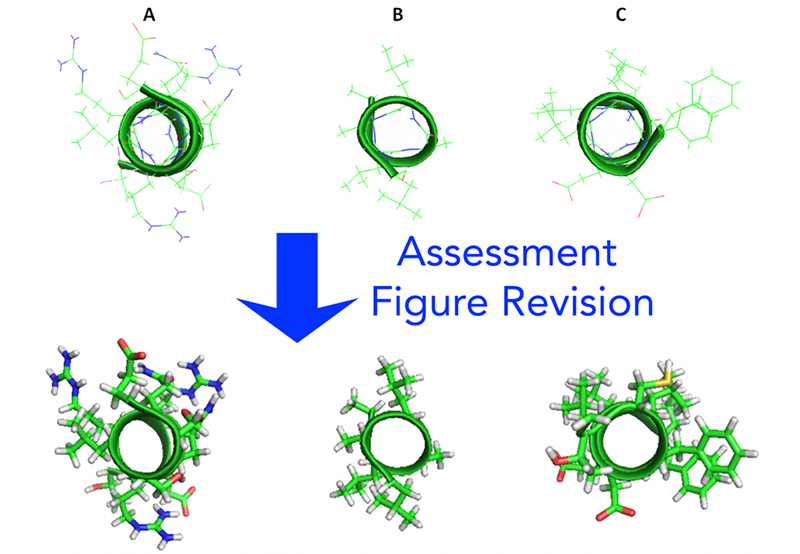
Revision of an assessment question to improve image clarity. Students select the amphipathic alpha-helix from the three choices.

San Diego workshop participants choosing structures from the PDB for assessments (right) and creating figures in PyMOL (left)
To create this repository of peer-reviewed assessments, the BioMolViz group engaged the broader community of biochemistry, chemistry, and molecular biology educators in one-day regional workshops focused on vetting the Molecular Visualization Framework and writing assessment questions. The topics were drawn from four of the overarching themes that surveyed faculty deemed most important to their teaching. Over 80 educators from 49 US-based institutions participated in one of four NSF-funded workshops at the following locations: Georgia Institute of Technology (Atlanta, GA), Washington University (St. Louis, MO), Morgan State University (Baltimore, MD), and the University of San Diego (San Diego, CA).5
Teams of four instructors wrote questions within the context of the framework, targeting either early college students (“novice” level) or juniors/seniors (“amateur” level). Instructors used PDB structures in various ways to create assessments. One multiple choice question required students to choose the amphipathic alpha helix from several images, while others required students to examine a labeled figure to identify potential hydrogen bonds. Some amateur level questions provided students with a PDB ID to generate their own image. The assessment types reflected the varied way that instructors use MV in their classes and different needs of instructors. The team-written assessments were then revised by a new team of four for clarity, both in wording and figures. Additionally, the new group evaluated how the question could be modified to apply to a wide range of macromolecules. Over 100 MV questions were generated through these productive sessions, and participants indicated in post-workshop surveys that they felt they were able to make good progress in developing a refined process to write, review, and approve assessments.
In January of 2019, the BioMolViz group will reconvene with a group of prior workshop participants at the University of Delaware to prepare the assessment instruments from the 2018 workshops for integration into an online framework, moving us closer to our goal of generating a user-friendly online repository where instructors can download high quality assessment instruments to further their MV instruction. An accessible repository will allow instructors to readily determine if students indeed “see what they see,” and improve molecular visualization instruction across the chemistry, biochemistry, and molecular biology community.
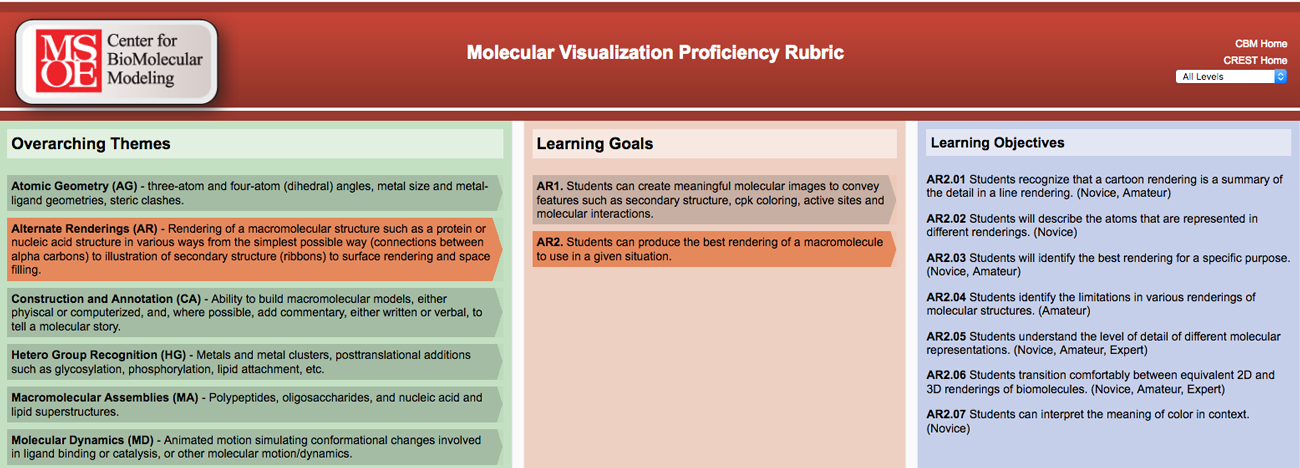
Responsive Molecular Visualization Proficiency Rubric; selection of a theme populates the Goals and Objectives columns.
References
- Linenberger, Kimberly J., and Thomas A. Holme. “Biochemistry Instructors’ Views toward Developing and Assessing Visual Literacy in Their Courses.” J. Chem. Educ. 2015, 92, 23–31. DOI:10.1021/ed500420r.
- Vanessa J. S. V. dos Santos, Eduardo Galembeck. “Metabolic pathways visualization skills development by undergraduate students” Biochem. Mol. Biol. Educ. 2015, 43, 162–167. DOI: 10.1002/bmb.20858
-
- Craig, P. A survey on faculty perspectives on the transition to a biochemistry course‐based undergraduate research experience laboratory. Biochem. Mol. Biol. Educ. 2017, 45, 426–436. DOI:10.1002/bmb.21060
- Beckham, J. Education Corner. RCSB PDB Newsletter 2014, 61.
- Dries, Daniel R., Dean, Diane M., Listenberger, Laura L., Novak, Walter R.P., Franzen, Margaret A. and Craig, Paul A. “An expanded framework for biomolecular visualization in the classroom: Learning goals and competencies”. Biochem. Mol. Biol. Educ. 2016, 45, 69-75. DOI: 10.1002/bmb.20991
- NSF Award Search: Award#0957205 - IUSE: “Building an Inclusive Community of Biochemistry and Molecular Biology Educators to Develop Competencies for Facilitating Biomolecular Visual Literacy” 2017.