Data Exploration Services
RCSB.org Statistics
Website traffic is tracked using AWstats. RCSB.org is visited by >1 million unique visitors/year.
| Month | Unique Visitors | Visits | Bandwidth |
|---|---|---|---|
| July 2018 | 441,657 | 1,435,199 | 2182.62 GB |
| August 2018 | 426,638 | 1,336,378 | 1921.11 GB |
| September 2018 | 489,292 | 1,550,503 | 2473.55 GB |
Postdocs and Developers: Join Our Team
RCSB PDB is looking for Scientific Software Developers, Front End Developers, and Postdoctoral Fellows in to join the Development Team at UC San Diego.
The Challenge: Develop innovative analysis, integration, query, and visualization tools for 3D biomolecular structures to help accelerate research and training in biology, medicine, and related disciplines. In these projects, we employ the latest advances in computer science to develop highly interactive features and scalable services and workflows. This is a unique opportunity to engage in leading edge research, development, and outreach activities of the RCSB PDB with worldwide impact. For more, visit our Careers page or Contact Us with questions.
Explore Distance, Angle, and Dihedral Measurements
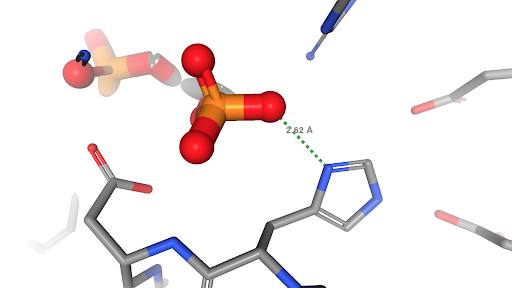
Measuring a distance between phytic acid and the catylitic histidine in the active site of phytase using the Ligand View option in NGL (PDB structure 1dkq). More on phytase at Molecule of the Month.
These electron density maps can be viewed in 3D at rcsb.org using NGL. Both 2fo-fc and fo-fc maps are available, and can be displayed at different sigma levels and styles. Shown: Electron density 2fo-fc map for PDB structure 1CBS centered around Retinoic Acid (REA) at 1 sigma contour level.
To begin a measurement in the NGL Ligand View, use the right-mouse button (or the left-mouse button and the Control key/Control key and mouse click) to select 1, 2, 3 or 4 atoms. Complete the measurement by selecting the final atom twice. Depending on how many atoms are selected, the distance (2 atoms), the angle (3 atoms) or the dihedral angle (4 atoms) is measured and displayed. Deselect all atoms with a right-click in empty space. To remove a measurement, re-select all involved atoms and then the last atom twice in a row.