Data Exploration Services
RCSB.org Statistics
Traffic is tracked using AWstats. RCSB.org is visited by >1 million unique visitors/year.
| Month | Unique Visitors | Visits | Bandwidth |
|---|---|---|---|
| January 2019 | 550,630 | 1,755,684 | 3441.88 GB |
| February 2019 | 567,111 | 1,749,232 | 7049.39 GB |
| March 2019 | 616,125 | 1,902,174 | 8767.70 GB |
Front End Developers: Join Our Team
RCSB PDB is looking for a Front End Developer to join the Development Team at Rutgers, The State University of New Jersey.
Open positions:
Front End Web Application Developer (Full-Time)
Front End Student Intern (Summer 2019)
Develop state-of-the-art features and search/reporting tools for RCSB.org that will support a broad spectrum of users from high school students to professional scientists.
For more, visit our Careers page or Contact Us with questions.

Visualize Structure Quality Metrics in 3D
wwPDB Validation Reports are available for every entry to provide an assessment of the quality of a structure and highlight specific concerns by considering the model coordinates, experimental data, and fit between the two.
Use RCSB PDB's viewer (NGL) to display information from this report in 3D. An NGL feature overview is available.
1. Color By Random Coil Index:
For NMR structures with available chemical shift data, the "NMR Random Coil Index" (RCI) scheme colors a structure according to the probability that the given residue is disordered ("random coil-like"). The color of each residue indicates whether the residue is classified as rigid (blue, RCI = 0.0) or flexible (red, RCI = 0.6). Residue coloring is based on the measured chemical shifts and on the primary sequence of the protein chain (for more on RCI, see Berjanskii 2005 and Berjanskii 2008). Residues without chemical shift data are displayed in gray.

NGL view using the Color by Random by Coil Index option (PDB structure 2n2t)
2. Color By Density Fit:
For structures determined using X-ray crystallography with available structure factors, Density Fitcolors a structure according to the quality of agreement between the model and the experimental electron density. Blue indicates a good fit for a residue and red a poor fit. Residue coloring is determined using normalized Real Space R (RSRZ) for polymer residues and real space correlation coefficient (RSCC) for ligands. Colors range from red (RSRZ=-2 or RSCC=0.678), through white, to blue (RSRZ=0 or RSCC=1.0).
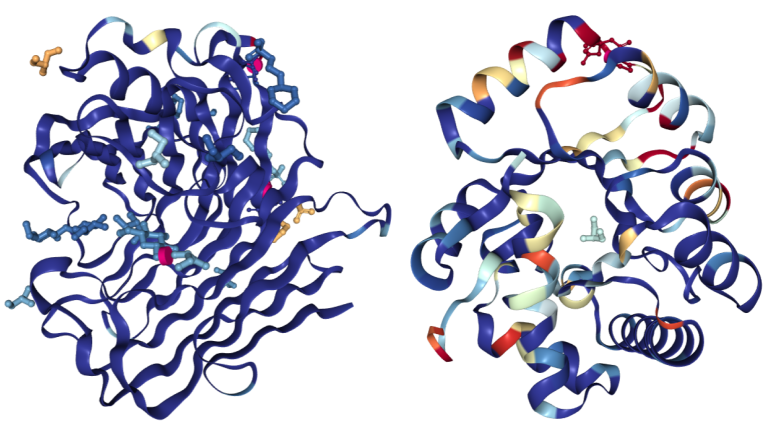
Hydrolases colored using the Density Fit scheme. On the left is a structure of Endoglucanase A (PDB structure 3WY6) with a generally good fit; on the right a structure of Ribonuclease P protein component 3 (PDB ID 3WYZ), which has areas of more problematic fit.
3. Color By Geometry Quality:
Color each polymer residue and ligand molecule according to the number of geometric issues (blue for 0, yellow for 1, orange for 2, and red for 3 or more). Protein residues and nucleotides are colored per residue whereas ligand molecules are colored per atom. Possible geometric issues include steric clashes, Ramachandran or RNA backbone outliers, and sidechain conformation outliers.
4. Show/Hide Clashes:
Select the Clashes checkbox to display clashes between pairs of atoms as pink discs, with the size of each disc reflecting the degree of van der Waals (vdW) overlap between the two atoms. Clash display is currently not available for structures comprising more than 10,000 residues.

A. PDB structure1FCC, a 3.2Å resolution structure with worse overall quality relative to all X-ray structures colored by Geometry Quality.
B.
A clash between two atoms is indicated by a pink disc, showing how much the atoms vdW spheres overlap.
Papers Published
Read about the RCSB PDB, wwPDB, and other molecular biology databases in Nucleic Acids Research’s 26th annual Database Issue. The article RCSB Protein Data Bank: biological macromolecular structures enabling research and education in fundamental biology, biomedicine, biotechnology and energy describes how the recent reorganization of RCSB PDB activities into four integrated, interdependent services is described in detail, together with tools and resources added over the past 2 years to RCSB PDB web portals in support of a Structural View of Biology.
S. K. Burley, H. M. Berman, C. Bhikadiya, C. Bi, L. Chen, L. Di Costanzo, C. Christie, K. Dalenberg, J. M. Duarte, S. Dutta, Z. Feng, S. Ghosh, D. S. Goodsell, R. K. Green, V. Guranovic, D. Guzenko, B. P. Hudson, T. Kalro, Y. Liang, R. Lowe, H. Namkoong, E. Peisach, I. Periskova, A. Prlic, C. Randle, A. Rose, P. Rose, R. Sala, M. Sekharan, C. Shao, L. Tan, Y. P. Tao, Y. Valasatava, M. Voigt, J. Westbrook, J. Woo, H. Yang, J. Young, M. Zhuravleva, C. Zardecki(2019) RCSB Protein Data Bank: biological macromolecular structures enabling research and education in fundamental biology, biomedicine, biotechnology and energy. Nucleic Acids Res 47: D464-D474.
DOI: 10.1093/nar/gky1004
A recent Scientific Data publication examined Nucleic Acids Research Database Issues to study PDB impact. Citations to the inaugural RCSB PDB publication (Berman et al., 2000 Nucleic Acids Res 28: 235-242) and the extent of PDB data usage by the resources described in these annual issues were studied. The analysis explores which subject fields are using PDB resources beyond molecular biology and biochemistry.
C. Markosian, L. D. Costanzo, M. Sekharan, C. Shao, S. K. Burley, C. Zardecki.(2018) Analysis of impact metrics for the Protein Data Bank. Sci. Data 5: 180212.
Number of articles citing the inaugural Berman et al. (2000) reference each year.

A list of all RCSB PDB publications and information on citing RCSB PDB and related resources is available.