Education Corner
Using PDB Structures to Visualize Science
by Veronica Falconieri Hays, Falconieri Visuals

Veronica Falconieri Hays, MA, CMI
Veronica is the primary medical illustrator and animator of Falconieri Visuals, a studio specializing in creating molecular visualization for clients in research, biotech, and pharma. Prior to launching Falconieri Visuals, Veronica worked within a structural biology lab at the National Cancer Institute in Bethesda, MD, creating molecular illustrations and animations for scientist-to-scientist communications. She is a graduate of Smith College, and also earned an M.A. in Medical and Biological Illustration from Johns Hopkins University School of Medicine.
Follow her on Twitter @FalconieriV
As a medical illustrator, biological molecules are my favorite subjects to visualize. I enjoy walking the tightrope between known and unknown, exploring current research and creatively problem solving when I find knowledge gaps. The Protein Data Bank is an invaluable tool that I use almost daily when creating science visuals.
...Wait, you’ve never heard of medical illustrators? Well, that’s fair. We are a relatively small group. Here’s a quick introduction to the field.

Molecular Interactions Guide Neurons in the Developing Brain. Proposed cover created by Falconieri Visuals for Seiradake Lab, University of Oxford based on Del Toro et al. (Cell 2019 180: 323 - 339.e19 PMC31928845)

Pentameric Immunoglobulin A (IgA) binds virus in the gut. Proposed cover created by Falconieri Visuals for the Genentech Structural Biology Group based on Kumar et al. (Science 2020 367:1008-1014. doi: 10.1126/science.aaz5807)
Medical illustrators are professionals trained in both scientific subjects and visualization techniques. They apply these skills to illustration, animations, and interactives for clients ranging including pharma companies, law firms, publications, research labs, and beyond. Subjects range from public health to anatomy to cellular and molecular mechanisms. Our role is to educate and engage our audiences in science through visuals, whether they are experts or the general public.
Though each medical illustrator has a unique background, I built my science and art skills starting in undergrad. I studied biology and art at Smith College, where my love of cellular biology really bloomed as I studied developing muscle cells under the microscope for independent research. Afterwards I attended the Johns Hopkins School of Medicine’s medical illustration graduate program. There I learned traditional and digital art techniques as applied to medical and scientific subject matter in addition to anatomy and business practices.
My particular interest in the microscopic (and sub-microscopic) led to my first position as a biomedical illustrator within Sriram Subramaniam’s high-resolution electron microscopy lab at the National Cancer Institute. As I created visuals for publications and presentations, I was immersed in the world of electron microscopy (especially cryo-EM) as applied to structural biology, viral biology, and cell ultrastructure.
Now, I apply my knowledge of biological molecules to the illustrations and animations that I create for clients ranging from academic researchers to biotech start-ups through my company, Falconieri Visuals.
Why do medical illustrators use PDB data?
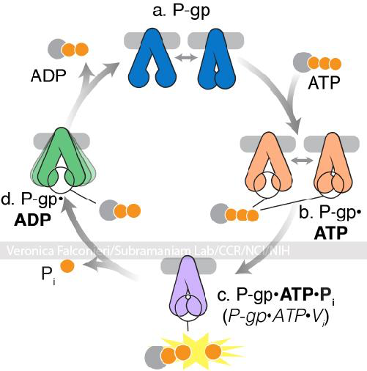
An example of biological molecules shown as simplified shapes. Figure created by Veronica Falconieri Hays for Subramaniam Lab / CCR / NCI / NIH. (Molecular Pharmacology 2016 90: 35-41 PMC4931865)
Medical illustrators strive to show science as accurately as possible within the time and didactic constraints of each visualization project. If it is visually effective to show a molecule in detail and if there is data available for what that structure looks like, then we try to find it and use it.
I find that for many illustrations that convey a complex story about a biological molecule, simplified 2D shapes do better because they are simple and undistracting. These work well for expert audiences who are already engaged in the subject matter due to mutual intellectual interest, or for less familiar audiences who have already had their interest captured by a more engaging “promo” visual (more on those below).
Having had the opportunity to work alongside scientists in a research lab, I also want to celebrate and highlight the work of structural biologists and microscopists. Every visualization that I make brings together research from across disciplines on the shapes of molecules, cells, and tissues. There are countless tiny details in each image that each reflect countless hours of work by diligent researchers, and I strive to show those details in all their beauty.
However, in illustrations or animations where I want to capture the viewer’s imagination, I like to show biological molecules in complete 3D detail. These can be promo visuals that headline articles or websites for public audiences or experts in different fields, or cover images for journals that seek to appeal to researchers in diverse specialties. I want to hook my viewer with a glimpse into another world, one with tiny, blobby machines carrying out actions that impact our health, our development…everything.
How PDB structures are used
Now onto the nitty gritty. How exactly do I do what I do? I combine many techniques, mostly digital, into my final pieces, including 3D modeling, animation, and rendering and 2D compositing and drawing. It all depends what the goals and constraints of the project are. I’ll describe my typical workflow when I am using data from the PDB here.

Maxon Cinema4D working environment for SARS-CoV-2 virion model.

Structure of the SARS-CoV-2 virion. Created by Falconieri Visuals for Scientific American. Research and modeling completed in April, 2020. See "Inside the Coronavirus" in Scientific American 200 323: 32-37 doi: 10.1038/scientificamerican0720-32
Once I find PDB entries for a molecule, I load the PDB files into my 3D animation software, Maxon Cinema4D, using the embedded Python Molecular Viewer (ePMV) plugin developed by the Olson Laboratory at Scripps Research Institute (1). Using ePMV, I can generate any molecular representations that I need. When showing a larger scene, I usually use a surface representation in order to capture the approximate size and shape of the molecule. For small molecules like drugs and metabolites, if they are seen up close within the scene, I might use a combination of a ball and stick model and a transparent surface.
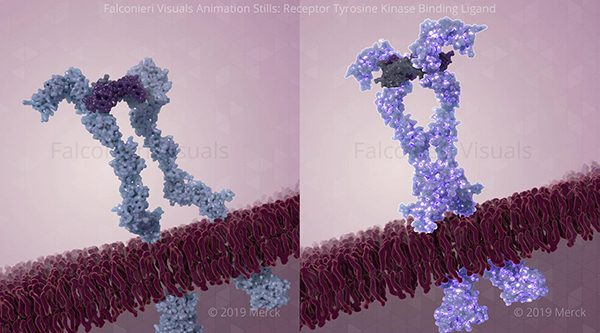
Receptor Tyrosine Kinase Binding Ligand (Animation Stills). Created by Falconieri Visuals for Merck. ©2019 Merck.
If there isn’t a complete structure of a molecule, I will do my best to assemble it from partial or homologous structures. Receptor tyrosine kinases, for example, are common illustration subjects, but their structures are found in pieces - extracellular, transmembrane, and intracellular. I’ll line these pieces up in Cinema4D to get an approximation of what the whole receptor may look like.
For larger structures, like virions, I will try to find microscopy data for the overall shapes and component distributions, and then assemble the molecular pieces (lipids, nucleic acids, and protein structures from the PDB) into the whole structure. (For an in-depth walkthrough of this process for the SARS-CoV-2 image shown here, check out “How I Built a 3-D Model of the Coronavirus for Scientific American”.)
If you want to learn more about medical illustration, I highly recommend the Association of Medical Illustrators website, www.AMI.org. There you can read about the field in general, career paths and education options, and view award winning medical illustrations and animations.
References
- Johnson, G.T. and Autin, L., Goodsell, D.S., Sanner, M.F., Olson, A.J. (2011). ePMV Embeds Molecular Modeling into Professional Animation Software Environments. Structure 19, 293-303.