for Structural Bioinformatics Protein Data Bank
Winter 2010
Number 44
| EDUCATION
CORNER A Search for Best Methods to Illustrate Complex Information by IJsbrand M. Kramer, Ph.D. Structure-based function analysis of cellular components has expanded rapidly over recent years and has consequently led to the development of a new semiotic system for teaching.1 The infographic approach has shifted from a schematic towards a more realistic representation of cellular components. The radical difference in conceptual artwork of cell and molecular biology (and biochemistry) in current course books compared to those of only 10 years ago exemplifies this change. Realistic illustrations of "invisible" subcellular objects closely resemble experimentally-derived structures of cellular components and are characterized by a low level of styling and simplification.2; 3 In contrast to the representation of macroscopic objects, where realistic images are generally easy to understand because they bear direct visual references to everyday life objects, realistic images of microscopic objects are necessarily difficult to understand because they lack visual reference–on top of that, they tend to be complex! Microscopic objects cannot be observed by the naked eye. Worse, the raw experimental data obtained from crystallographic X-ray diffraction or NMR studies have proven incomprehensible to the non-expert brain. Digesting these experimental results requires computer-aided image processing and this implies that the depiction of microscopic objects is necessary representational–and thus "abstract". With reference to the cognitive load theory, cell and molecular biology images always carry a high intrinsic cognitive load.4; 5 Independent of the type of representation chosen, being realistic or schematic, these images are difficult because they require a thorough understanding of numerous iconic (object represents a molecule) and scientific codes (object represents a membrane receptor involved in a signaling cascade) in order to be meaningful.6 In cell biology teaching, I discern a number of forces driving towards the adoption of realistic images. Firstly, structural analysis provides a much more meaningful understanding of the functioning of cellular components, and in particular of proteins.7; 8 Secondly, many cellular processes seem to occur in multi-protein complexes (comprising scaffold, adaptor and effector proteins), kept together by domain-specific interactions. While attempting to represent schematically the different domains and how they form protein assemblies, one quickly asks the question; what does it really look like? Thirdly, students have to be prepared for the post-genomic era, characterized by an explosion of genes, gene products and structural analyses. Ideally, they should be confronted with the new infographic approach at an early stage in order to prevent a very steep learning curve at the end of their studies. Finally, many teachers have a natural tendency towards the inclusion of state-of-the-art molecular representations because they reflect better their level of understanding. This tendency is encouraged by the ample supply of state-of-the-art scientific illustrations in science (review) journals, by the availability of web-based tools for macromolecular visualization and, last but not least, by easy access to the 3D coordinates of macromolecules via the PDB.
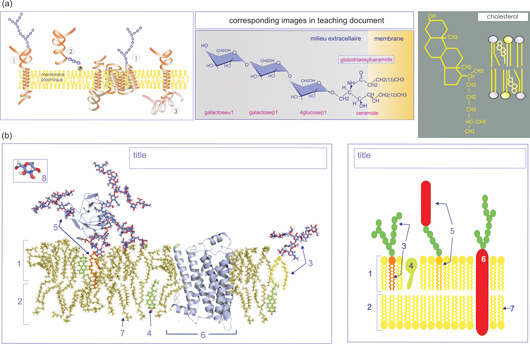
Not all university teachers follow this path. Some strongly oppose realistic images and advocate to keep things simple for introductory courses because images only have to convey the "basic principles and concepts" of cell biology. Others are reticent simply because they themselves fail to provide meaning to the novel infographic approach or lack the molecular-graphic and multimedia skills necessary to embark on the transformation process. All the above arguments are valid from a teachers’ point of view, but teachers are experts, and experts tend to forget how the unprepared mind functions (or how their unprepared mind functioned)9. What really matters is to find out what our learners read in the images we provide. I therefore have set out a series of tests, in collaboration with Hassen-Reda Dahmani and Patricia Schneeberger (University Victor Segalen Bordeaux 2), in which students attending an introductory cell biology course at the University of Bordeaux 1 (first year Life and Environmental Sciences) were confronted with images that represented the same cellular component but with different infographic approaches (see Figure 1 as one example)3. In order to prevent conditioned reflexes, none of these images strongly resembled the ones used in the accompanying teaching documents (www.cellbiol.net/cbe/multimedia.php). What we learned was that our first year students can handle complex realistic images and that the apparent complexity does not deter them from investigating their meaning.3 We like to stress, however, that when teachers adopt a realistic iconographic approach, the images should naturally be accompanied by coherent explanatory text, relevant knowledge evaluation, and an engaging environment that encourages the learner to develop mental representations of the subjects in question.10 Perhaps one of the most challenging aspects of current cell biology education is designing course instructions that without denying the complexity of cell functioning, allow students to access the complexity in a meaningful way. An approach that allows them to develop relevant schemas (mental images, models) with which they are able to construct, over the years, an operational understanding of the cell needs to be used.4; 5; 11-13 Together with Graham Johnson (The Scripps Research Institute) and Lena Tibell (University of Linkoping), and thanks to funding by the National Science Foundation, this research project is now being pursued in a much broader teaching environment. These reflections about teaching, and the ensuing pedagogical study, have been instigated in part by the desire to construct learning documents (web-based multimedia resources as well as books) that could accompany the learner throughout the learning path, starting at the university and beyond–life-long learning. Through teaching both first and third year students, I realized the convenience of adopting a universal (realistic) infographic approach; it allows me to smoothly integrate first year cell biology course material with the third year signal transduction teaching. I also discovered that the approach to conceptual artwork described above has the important advantage of being more amenable to an accompanying hands-on molecular modeling practical (biocomputing practical); there is less discrepancy between what students obtain on the computer screen, what they may encounter in the literature, and what they see in their teaching documents. Linking lecture content with hands-on molecular modeling, seeing and doing, enhances students’ understanding of the nanoscale world.14 The PDB has therefore become a key source for my educational endeavor. Students are not my only concern: After 20 years of teaching I also learned that pedagogical (what to teach) and didactical (how to teach it) innovations provide me with the necessary "reward" to sustain teaching activities (in particular in moments where university management, teachers and students alike seem to have forgotten the real purpose of education). The pedagogical activities developed by the RCSB PDB, in particular, the work by David Goodsell, continue to be an inspiring and comforting source of information, as are the many other outstanding annotated databases in life sciences.  Figure 1 (click to enlarge). Realistic versus schematic representation of the plasma membrane. (a) Course images of the plasma membrane; three relevant images from the teaching document are shown. (b) Test images of the plasma membrane: realistic representation (left) and schematic representation (right). The membrane components in the realistic representation are all based on experimentally derived structures. The phospholipid bilayer coordinates were obtained from equilibrated structures after molecular dynamics simulation (N. Taib), and the coordinates of the Thy1-glycosylated peripheral membrane protein were provided by M. Wormald. The structure of the b2-adrenergic receptor (PDB ID: 2rh1)15 and of cholesterol (PDB ID: 1ssj)16 were obtained from the PDB. The glycerol-glycolipid is a compilation of diacylglycerol combined with one of the sugar chains of Thy1 (an Adobe Photoshop cut-and-paste preparation). The schematic representation was found on the web and modified for our purposes. Students had to provide a title [cell membrane, lipid bilayer with (glyco)proteins] and label the numbered components: 1) membrane outer leaflet; 2) membrane inner leaflet; 3) glycerol-glycolipid; 4) cholesterol; 5) glycosylated peripheral-membrane protein (Thy1); 6) transmembrane protein (b2-adrenergic receptor); 7) phospholipids; and 8) sugar or hexose (only in realistic representation). In the schematic representation test, students had to decipher the iconic code for the green (sugar or hexose) and yellow (phospholipid headgroups) spheres. Finally, they were asked to provide a stick representation of a phospholipid. Figure and caption reprinted from Dahmani et al.3 with permission.
|
E-mail: info@rcsb.org • Web: www.pdb.org • FTP: ftp.wwpdb.org
The RCSB PDB is a member of the wwPDB (www.wwpdb.org)

