| PDB
COMMUNITY FOCUS
Christine Orengo is a Professor of Bioinformatics
in the Structural and Molecular Biology Research Department of University
College London (UCL). She studied chemical physics at Bristol University
and was awarded a Ph.D. in enzyme kinetics at UCL in 1984. Following
a brief spell in industry, she worked as a research fellow at the
National Institute for Medical Research (NIMR) in London before
moving back to UCL in 1992 to pursue further postdoctoral studies.
She was awarded a Senior Research Fellowship by the Medical Research
Council in 1995 and was appointed Chair in Bioinformatics in 2002.
Together with Janet Thornton, she established the CATH domain structure
classification in 1993 which led to the discovery of some highly
populated fold groups in nature–the
so-called superfolds.
Her current research interests are in structural, functional, and
comparative genomics. Computational analyses exploit the CATH database
of structural families and the more recently established sister
resource for domain and protein families in completed genomes, Gene3D.
She collaborates with a number of experimental groups involved in
studying pain, cancer and host-viral interactions. She also participates
in several European networks for genome annotation (Biosapiens),
grid technologies (EMBRACE), and systems biology (ENFIN) and is
a member of the NIH-funded PSI Midwest Center for Structural Genomics
(MCSG) headed by Andrzej Joachimiak. She was one of the founding
researchers of the bioinformatics based Inpharmatica company. She
has authored over 150 papers, book chapters and reviews and is on
the editorial board of FEBS, BMC Structural Biology, PEDS, and
the Journal of Structural and Functional Genomics.
She is on the advisory board of the Swiss Institute of Bioinformatics
and the Marie Nostrum Supercomputer Centre in Barcelona.
Dr. Christine Orengo, University
College London
Q.
In 1997, you and your colleagues established CATH1–a
system that is used to classify protein domain structures. How are
researchers using CATH today? What types of research and discoveries
does it enable? Has its usage changed in the past ten years?
 A:
In the early 1990s, there were over three thousand structures deposited
in the PDB and Janet Thornton realized that we could get some very
useful insights into protein folding and evolution by grouping these
into fold groups and evolutionary families. I was fortunate to join
her group at that time and we set about doing this classification
with the benefit of a very sensitive structure comparison algorithm
developed by Willie Taylor and myself, at NIMR. We designed a hierarchical
classification which grouped proteins according to their basic secondary
structure composition (Class), 3D shape (Architecture), folding
arrangement (Topology), and finally evolutionary ancestry (Homology).
Although we largely use automated approaches, identifying domain
boundaries in multi-domain proteins, and recognizing homologues
are difficult and very time consuming, as they need manual validation,
which is why we only have ~80% of the PDB classified to date. We
have just introduced some sophisticated new protocols that we think
will help us to increase this percentage over the next year. A:
In the early 1990s, there were over three thousand structures deposited
in the PDB and Janet Thornton realized that we could get some very
useful insights into protein folding and evolution by grouping these
into fold groups and evolutionary families. I was fortunate to join
her group at that time and we set about doing this classification
with the benefit of a very sensitive structure comparison algorithm
developed by Willie Taylor and myself, at NIMR. We designed a hierarchical
classification which grouped proteins according to their basic secondary
structure composition (Class), 3D shape (Architecture), folding
arrangement (Topology), and finally evolutionary ancestry (Homology).
Although we largely use automated approaches, identifying domain
boundaries in multi-domain proteins, and recognizing homologues
are difficult and very time consuming, as they need manual validation,
which is why we only have ~80% of the PDB classified to date. We
have just introduced some sophisticated new protocols that we think
will help us to increase this percentage over the next year.
Despite this slight lag with the PDB, CATH is widely used and currently
receives about a million web page hits per month from sites all
over the world. We have put considerable effort into the design
of the resource, trying to present the information in an intuitive
and easily accessible form, and I believe this is reflected in its
high usage. SCOP2, a related resource, is also very widely
used but because we exploit slightly different criteria to classify
folds and provide additional information on superfamilies (e.g.
multiple structure alignments), the two resources are somewhat complimentary.
I think CATH is particularly useful for teaching. Perhaps the other
distinctive feature of CATH is that we have developed our own structure
comparison methods and provide a service (CATHEDRAL web server)3
for scanning new structures against representative domains. This
is very popular with structural biologists as it can be used to
recognize novel folds or classify new structures into existing superfamilies.
The CATH fold library is also exploited by computational biologists
developing methods to predict whether a sequence is likely to adopt
one of the known structures.
We have now extended CATH to include all sequences in the genomes
that can be predicted to belong to a CATH superfamily (CATH-Gene3D)4
and this has allowed us to increase the functional annotations associated
with each superfamily hugely. Biologists are increasingly using
CATH and Gene3D to obtain structural and functional annotations
for their proteins and this has been facilitated by further dissemination
of the information through the DAS annotation systems set up by
the Biosapiens network (www.biosapiens.info).
Perhaps one of the most interesting phenomena revealed by classifying
structures is the incredible bias in the populations of the fold
groups and evolutionary superfamilies. In 1994, Janet Thornton and
I reported the existence of the superfolds, a set of 10 folds which
were highly over-represented in CATH5. This trend still
exists and the integration of sequence data through Gene3D has shown
that it is not an artifact of sampling but a genuine reflection
of the dominance of certain folds in nature. The bias is also apparent
at the evolutionary superfamily level. For instance, the 100 largest
superfamilies in CATH account for nearly half the domain sequences
of predicted structures in completed genomes.
As CATH has become more highly populated, it has been used to study
and characterize the structural mechanisms involved in the evolution
of proteins and their functions; in particular, the extent to which
structural embellishments to the domain core can modify the geometry
of active sites or influence surface features mediating different
protein-protein interactions. The integration of genome sequences
in CATH-Gene3D has illuminated functional diversity across superfamilies,
and recent changes in the usage of CATH reflects biologists’
interests in performing comparative genome analyses with this extensive
functional data. For example, a comparison of CATH superfamilies,
universal to bacteria, revealed that the expansion of metabolic
and regulatory superfamilies with genome size is balanced, allowing
maximum enrichment of the metabolic repertoire within the constraints
of maintaining a small genome for fast replication.6
Q.
Do you think that we are close to having representatives of every
possible fold? Have the structural genomics projects had an impact?
A. I think this depends on
one’s definition of a fold. The huge structural diversity
apparent in some of the largest CATH superfamilies has challenged
my belief in a rigid hierarchical classification whereby relatives
in each evolutionary superfamily adopt the same fold. For example,
there is great structural diversity in many of the 100 most highly
populated superfamilies, and there are clear examples of relatives
with different folds. Whilst these relatives share 40-50% of residues
in the cores of their structures, these cores can be embellished
so differently that many structural biologists would say that the
domains belong to different fold groups. That said, for the remaining
~2000 superfamilies, relatives can be characterized within a single
fold group and so I feel that the topology or fold group level in
CATH is still valuable.
The structural genomics initiatives, particularly the PSI initiative
in the States which has the goal of solving novel folds and aims
to determine structures for all large protein families, are helping
both to increase the numbers of known folds in the PDB and also
to address the question of whether the hundreds of thousands of
apparently novel superfamilies in the genomes are truly novel, adopting
folds that are distinct from anything seen before. These initiatives
have been very successful in increasing the numbers of new folds
deposited in the PDB each year. For example, over the last two years
a large proportion of the novel folds in the PDB have come from
the four major centers associated with this initiative. Interestingly,
although PSI deliberately targets superfamilies thought to be unrelated
to any known superfamilies in SCOP or CATH, only about 30% turn
out to be new superfamilies with distinct folds once their structures
are solved. The remainder have been found to be distant relatives
of known fold groups and families.
As to whether we have representatives of every possible fold, our
analysis of genome data using sensitive threading algorithms like
David Jones’s GenThreader7 suggests that within
each organism about 80% of sequences can now be assigned to one
of ~1100 CATH folds. Thus I would say that we do have fold representatives
for most of the major superfamilies in nature. However, nearly half
of these predicted structures belong to the 100 very structurally-diverse
superfamiles and so it is possible their folds may be slightly different
to those already characterized.
Sequences which can’t be assigned a fold in CATH tend to belong
to very small superfamilies which are species-specific. The number
of these superfamilies is growing enormously as the metagenomics
initiatives continue. For example, sampling of bacterial proteins
from different environments like the Sargasso sea, diverse soils
and even the human gut, suggests the existence of hundreds of thousands
of very small families and orphan sequences for which we have no
structural data at present. Although some of these may be genuinely
new superfamilies with folds never seen before, it is more likely
that a significant proportion will be found to be distant relatives
of structurally characterized families. Some divergence in the structure
of these remote relatives would be likely as the different environmental
contexts would probably result in the evolution of different functions,
and this is frequently mediated by changes in the structure.
The problem in estimating the number of folds that remain to be
determined lies in the currently rather subjective approaches used
for defining fold similarity. If we assume two domains have similar
folds–if they superpose with an RMSD less than 5Å, (normalized
for the number of equivalent residues)–we actually find that
there are nearly three times as many folds in CATH than represented
by the ~1100 fold groups. Practically all of this increase is due
to the structural diversity occurring across the 100 largest superfamilies.
Since we know that a significant proportion of sequences from each
organism are typically assigned to these very large superfamilies,
as increasing numbers of structures are solved from different species,
the total number of folds will grow, simply from an expansion of
these very large superfamilies. In addition, since the thousands
of new families arising from the metagenomics will either have novel
folds or very likely be distant relatives of these very large superfamilies,
and therefore with slightly different folds, over the next decade
we could certainly see hundreds more structures which are rather
different from any known folds, especially if the structural genomics
initiatives continue to be funded.
However, as I mentioned before, whether we view these as completely
new folds depends on our definition of fold. We no longer refer
to the T level in CATH as the topology or fold group level but rather
the ‘topological motif’ or ‘fold motif’
level. In other words, structures grouped at this level share a
large central structural motif or core ‘fold motif’
comprising about 40-50% of the domain’s residues. I believe
that the majority of ‘fold motifs’ in nature have now
been characterized, with the structural genomics contributing significantly
to this repertoire of fold motifs over the last decade. Structures
remaining to be solved are highly likely to have core motifs similar
to one of the ~1100 fold motifs characterized in CATH or SCOP, but
these cores may be structurally decorated in ways not seen yet.
By improving the characterization of these fold motifs and understanding
the manner in which they can be structurally embellished, we hope
to improve the structural annotation and modeling of all the sequence
relatives in the genomes.
Regardless of the definition of a fold, we are interested in discovering
all the different ways in which proteins fold into their 3D dimensional
structure and interact with ligands. Gene3D was established to structurally
annotate the genomes and integrate functional data from all the
sequences. Using these data, we can better understand the structure-function
relationship with respect to protein-protein and protein-ligand
interactions. Although the ways in which proteins bind ATP could
be limitless, they are likely to be very similar in proteins with
the same fold. Therefore, by targeting predicted new folds and diverse
functional subfamilies the structural genomics initiatives should
deepen our understanding of protein folding and protein-ligand interactions
and move us further towards a structure-function model for all proteins.
Q.
Predicting the function of a given protein is a great challenge.
How do Gene3d and the PDB archive play into this type of research?
A. Clearly the value of structures
solved by the structural genomics initiatives increases once functions
become known for them or as methods for predicting function from
structure improve. To facilitate this, we have been increasing the
amount of functional information stored in Gene3D. Fortunately,
there are now many excellent public resources providing functional
information. Those captured in Gene3D include GO8, COGs,9
FunCat,10 and EC11 amongst others. We carefully
inherit this functional information between relatives using various
bioinformatics protocols. Some approaches exploit simple pair-wise
sequence identity between relatives whilst others use more sophisticated
methods (e.g. HMM-HMM comparisons) to allow safe inheritance between
more distant relatives sharing common functions. Knowledge of the
pathways or biological processes that a protein participates in
is also useful for understanding its functional role, and so we
have incorporated information on protein interactions in Gene3D
(e.g. from KEGG,12 Reactome,13 and IntAct14)
and developed a suite of bioinformatics tools for predicting interactions
between proteins, too. Integrating data in Gene3D in this way allows
us to draw together as much collated information on genes as possible
both to enhance biomedical research, as well as our model of protein
evolution.
The recently created PSI Structural Genomics Knowledgebase (kb.psi-structuralgenomics.org/KB)
will help enormously in extending the functional information available
for each structure. With the aim of integrating and presenting functional
information from a wide range of public resources, this will significantly
enhance structural studies on how proteins function. In addition,
other initiatives such as the EU-funded Biosapiens network for structural
and functional annotation of genomes will also play a part in providing
functional annotations for PDB structures. A recent analysis performed
for the Midwest Center for Structural Genomics showed that by using
Gene3D, some functional information could be gleaned for a large
proportion of sequences targeted for structure determination. Some
of this is rather general information and may not be that useful
at present, except in directing further experiments (e.g. mutation
experiments) but a reasonable proportion is detailed enough to allow
some mechanistic rationale to be derived from the solved structure.
Furthermore, since recent aims of the PSI structural genomics initiatives
include targeting additional relatives from the most highly populated
CATH superfamilies, relatives can be targeted which are predicted
to be functionally diverse from those with close homologues of known
structures. Expanding the repertoire of structures for different
functional subfamilies within these superfamilies will increase
our understanding of structure-function relationships and ultimately
improve function prediction methods. Recent analyses of structures
of unknown function solved by the Midwest consortium using the ProFunc
resource developed by the Thornton group, showed that some functional
information could be predicted for a large proportion of the structures.
This success rate is likely to increase as structural genomics initiatives
deliberately target sequences with known functions and the resulting
increase in coverage of structure-function space improves our function
prediction algorithms.
Q.
With Richard C. Garratt, you've recently published a great educational
tool called The Protein Chart.15 What was the inspiration for this
"periodic table" of proteins? How do you think it will
be used?
A. Richard and I really enjoyed
developing this chart and we had two excellent CATH researchers
in my group, Alison Cuff and Ian Sillitoe, who made the whole project
possible. The idea for a protein chart originally arose from the
structure modeling kit that Richard had designed for Wiley which
is a wonderful teaching tool for explaining how structures are built
from their component secondary structures. It’s really a Lego
toolkit for proteins! Wiley wanted a protein chart showing examples
of representative structures that students could try to build with
the kit. We were very excited by the project and inspired to produce
a design based on the ideal ‘periodic chart’ of protein
structures proposed by Willie Taylor a few years ago.16 This shows
simple representations of all the types of architectures or 3D protein
shapes that should be seen in nature given the rules drawn up over
the last three decades for protein folding and packing. We thought
Willie’s chart was a wonderful way of representing our current
knowledge of protein architectures and imagining what shapes and
folds remained to be discovered.
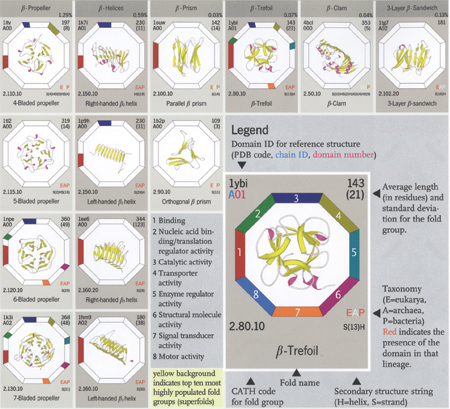
A section of the b-proteins shown in The Protein
Chart (www.wiley.com)
(Reprinted with permission)
So we designed a protein chart, arranged like a periodic table,
but showing representatives of all the domain architectures or shapes
currently deposited in the PDB and classified in CATH. There are
over 30 different architectures in CATH which are regular enough
for the 2D image of the structure to provide meaningful information,
and for each of these, the chart shows the ranges of sizes observed.
The chart also contains information on the proportion of genome
sequences that are predicted to adopt each type of shape, and also
the types of functions exhibited in the different fold groups. There
are also illustrations of common supersecondary motifs and oligomeric
proteins, and so we think it will be a very useful tool for undergraduate
teaching and also for structural biology researchers. I would imagine
that computational biologists developing structure prediction methods
will also find it a useful way of learning about the different shapes
and folds they are trying to predict. With the progress of the structural
genomics initiatives, especially the PSI, in solving novel structures,
we can expect the chart to evolve and expand over the next decade
and it will be a useful visual aid for monitoring our knowledge
of the structural universe.
- C.A. Orengo, A.D. Michie, S. Jones, D.T. Jones, M.B. Swindells,
and J.M. Thornton (1997) CATH–a hierarchic classification
of protein domain structures. Structure. 5:
1093-1108.
- L. Conte, A. Bart, T. Hubbard, S. Brenner, A. Murzin, and C.
Chothia (2000) SCOP: a structural classification of proteins database.
Nucleic Acids Res. 28(1): 257-259.
- O.C. Redfern, A. Harrison, T. Dallman, F.M. Pearl, and C.A.
Orengo (2007) CATHEDRAL: a fast and effective algorithm to predict
folds and domain boundaries from multidomain protein structures.
PLoS Comput Biol. 3(11): e232.
- C. Yeats, J. Lees, A. Reid, P. Kellam, N. Martin, X. Liu, and
C. Orengo (2008) Gene3D: comprehensive structural and functional
annotation of genomes. Nucleic Acids Res. 36
(Database issue): D414-8.
- J. Ranea, D. Buchan, J. Thornton, & C. Orengo (2005) Microeconomic
principles explain an optimal genome size in bacteria Genetics.
21: 21-25.
- C.A. Orengo, D.T. Jones, and J.M. Thornton (1994) Protein superfamilies
and domain superfolds. Nature. 372(6507):
631-4.
- D.T. Jones (1999) GenTHREADER: an efficient and reliable protein
fold recognition method for genomic sequences. J Mol Biol.
287(4): 797-815.
- The Gene Ontology Consortium (2000) Gene Ontology: tool for
the unification of biology. Nature Genetics. 25:
25-29.
- D.L. Wheeler, T. Barrett, D.A. Benson, S.H. Bryant, et al.
(2008) Database resources of the National Center for Biotechnology
Information. Nucleic Acids Res. 36(Database
issue): D13-21.
- A. Ruepp, A. Zollner, D. Maier, K. Albermann, et al. (2004)
The FunCat, a functional annotation scheme for systematic classification
of proteins from whole genomes. Nucleic Acids Res.
32(18): 5539-45.
- Enzyme Nomenclature, Enzyme Classification. www.chem.qmw.ac.uk/iubmb/enzyme.
- M. Kanehisa and S. Goto (2000) KEGG: Kyoto encyclopedia of
genes and genomes. Nucleic Acids Res. 28(1):
27-30.
- G. Joshi-Tope, M. Gillespie, I. Vastrik, P. D'Eustachio, et
al. (2005) Reactome: a knowledgebase of biological pathways. Nucleic
Acids Res. 33(Database issue): D428-32.
-
S. Kerrien, Y. Alam-Faruque, B. Aranda, I.
Bancarz, et al. (2007) IntAct–open source resource for
molecular inter action data. Nucleic Acids Res. 35(Database
issue): D561-5.
- R.C. Garratt and C. Orengo (2008) The Protein Chart Weinheim:
Wiley-VCH.
- W.R. Taylor (2002) A 'periodic table' for protein structures.
Nature 416: 657-60.
|